Blog -


Grafana Dashboards + AWS CloudWatch Metrics
In this article, my goal is to guide you through the creation of a simple Grafana graph using AWS CloudWatch metrics as a data source. We will do this with some context of how and why FloQast used these tools to better understand customer behavior and to make better decisions about how to solve problems.
The Players
First, a brief definition of the technologies used: Grafana is a monitoring tool that has multiple ways of visualizing data. Integrates with AWS Cloudwatch Metrics. AWS Cloudwatch Metrics is a convenient way to store metric data. It supports built-in metrics for other AWS services as well as custom metrics.
The Context AKA Our Sample Product
FloQast has an endpoint where our customers can upload a file. The app then copies that file to a number of locations in a customer’s FloQast account. Each copy file to location process ends by kicking off a job that syncs the data in the new file with data displayed in the app. After several months of onboarding customers to this feature, we started seeing a bottleneck in the processing of these sync jobs. The sync jobs start as messages on a queue, and this queue was not draining. In fact the number of messages on the queue was increasing and would have hit a size limit eventually. Customers also notified us that they were doing hourly file uploads and thus expected hourly syncs. However, their FloQast account data did not reflect these hourly updates.
To gain insight into this bottleneck, we needed to know how often customers were uploading files, and how many locations these files were being copied to (and therefore how many sync jobs were created).
For example, a customer might upload 1 file per day, but that file is mapped to 50 locations, thus 50 jobs/day. Alternatively, a customer might upload 1 file every 30 minutes, but that file is only mapped to one company, thus 48 jobs/day. Both setups produce roughly the same amount of jobs, but have different implications for how to solve the bottleneck. The right metrics would help us know what path to take (spoiler alert: turns out we had to solve for both).
The Code (in NodeJS)
The metric we want to track is the number of locations to which a single file is copied. We want each record of this metric to be associated with a customer. CloudWatch.putMetricData(params, cb) is your best friend for this purpose (documentation here).
Example code snippet to insert into our copy file to location function:
const AWS = require('aws-sdk');
const CloudWatch = new AWS.CloudWatch();

function updateLocationCountMetrics (numLocations, customerId) {
    const params = {
        MetricData: [
            {
                MetricName: 'customer-locations-count',
                Value: numLocations,
                Unit: 'Count',
                Dimensions: [
                    {
                        Name: 'customerId',
                        Value: customerId
                    }
                ]
            }
        ],
        Namespace: `fq-file-uploader`
    };
    CloudWatch.putMetricData(params, (err, res) => {
        if (err) {
            console.log(err)
        }
    });
}

updateLocationCountMetrics(25, '2222')
Namespace is an identifier that you can group related metrics under. For this example, I have named it after the feature/product being tracked.
Dimensions are pieces of metadata that you want to slice the metric on, in this case, some identifying information about a customer.
Once this is in your code, AWS CloudWatch Metrics will begin to populate with data. Time to look at it in Grafana.
The Grafana Graph
A Grafana admin will have to add AWS CloudWatch as a data source (documentation here).
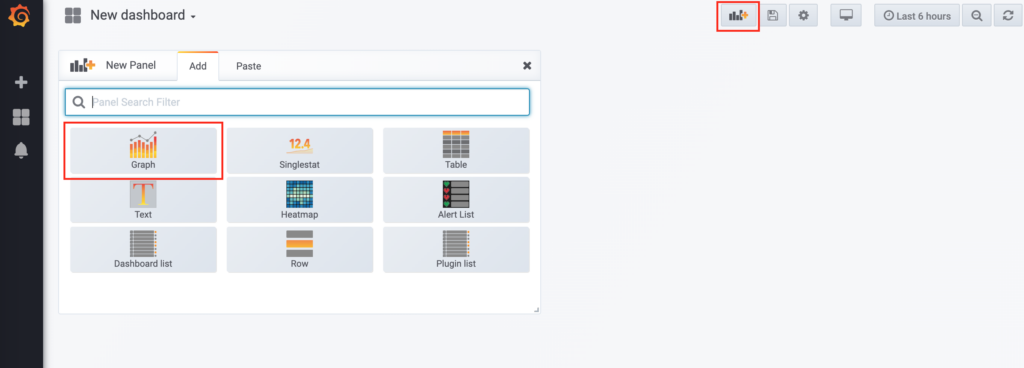
From a Grafana dashboard, click the Add panel button in the upper right. Select Graph.
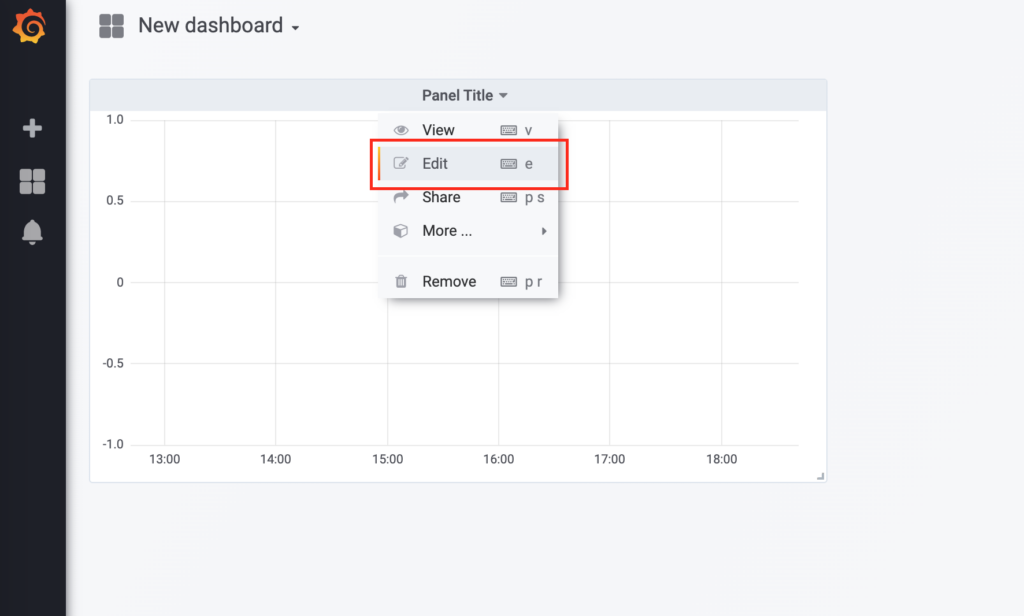
Open the dropdown menu on the graph’s title and select Edit.
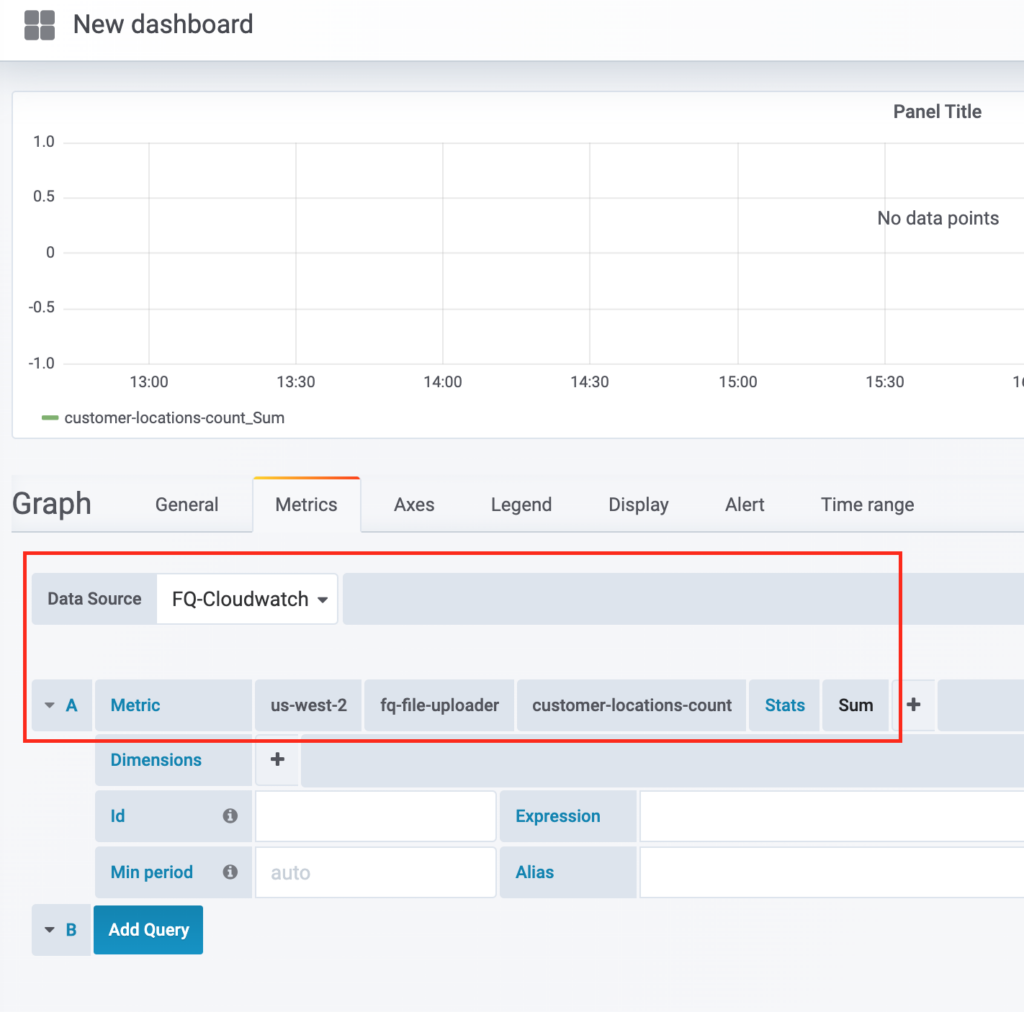
For Data Source select your AWS CloudWatch. Fill out the options in the Metric row. From left to right they are: AWS region, namespace, and metric name. For the Stats option select Sum (documentation here).
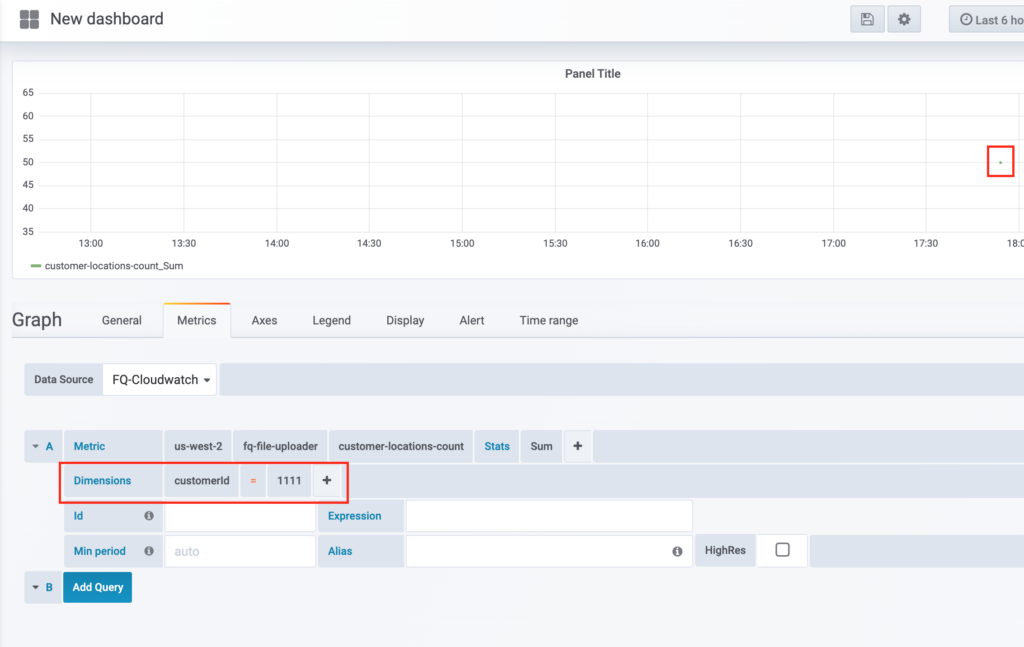
For the Dimensions row, add a new dimension, then fill in the name of the dimension, and then the value.
The graph is now populated with data from customer 1111, who sent messages to 50 locations. The way the graph is set up only allows us to view one customer’s data at a time, when it might be more useful to view all customers.
Fortunately we can accomplish this using Grafana’s variables feature. Select the settings gear wheel in the upper right. Click the Variables tab on the left sidebar and click Add variable.
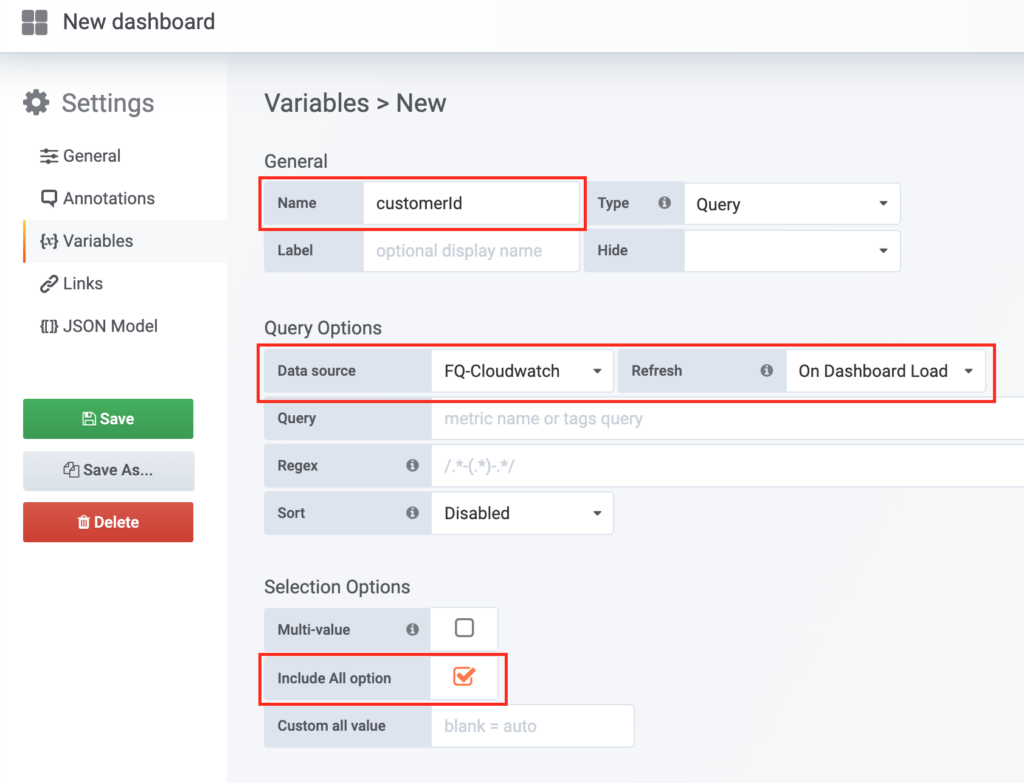
Fill out the name field, and select AWS CloudWatch as the Data Source. Set the Refresh option to On Dashboard Load. Enable the checkbox for Include All option.
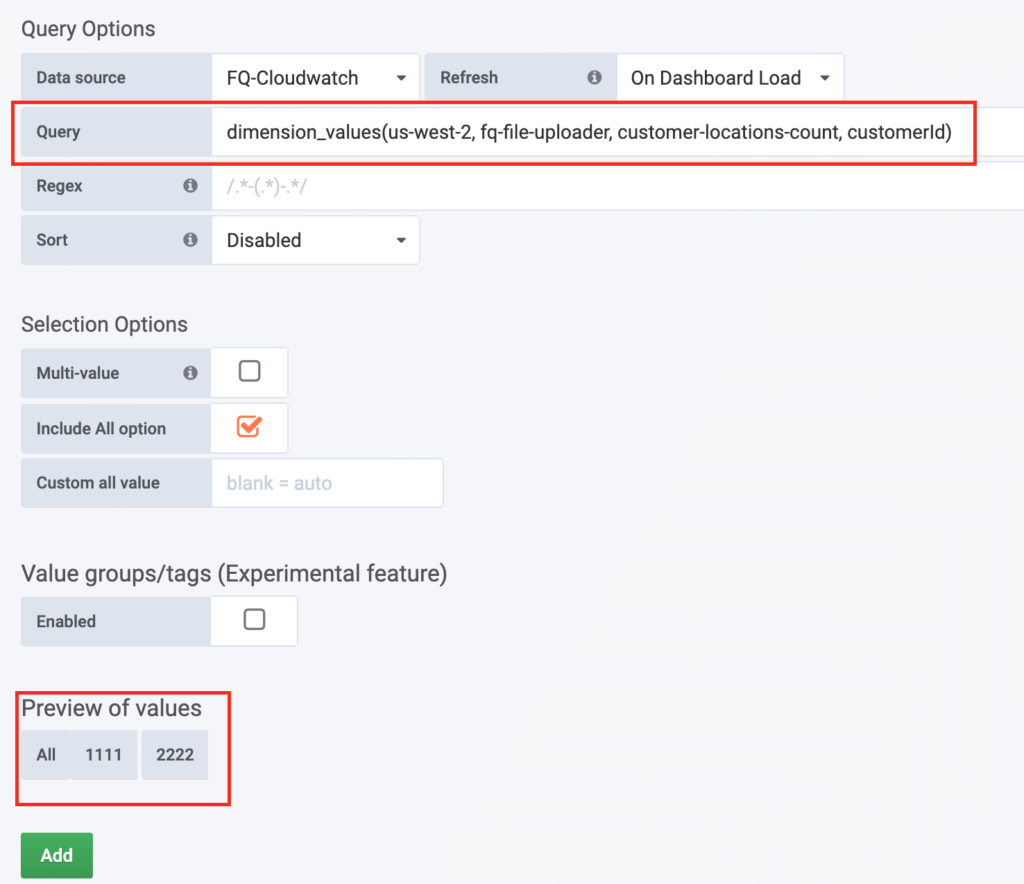
For the Query field, we must fill in what values we want this variable to represent, in this case, customerIds. The format is as follows: dimension_values(AWS_REGION, NAMESPACE, METRIC_NAME, DIMENSION_NAME). You should see a list at the bottom of the screen confirming the values (including the All option). Click Add and return to editing your graph (documentation here).
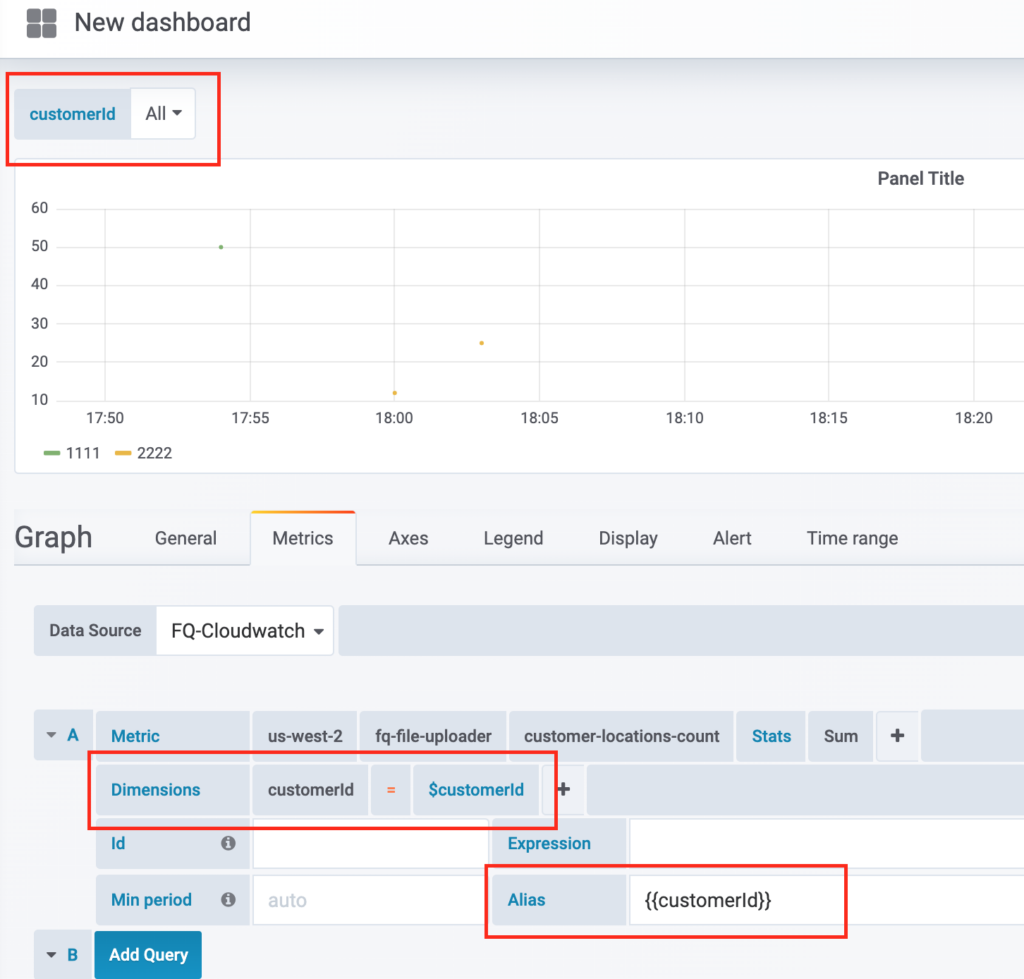
In the upper left, you should now see a dropdown for the variable you just created. Use it to select the All option. Back in the Dimensions row, change the value of the dimension to $VARIABLE_NAME. You should now be seeing multiple colors on your graph, each representing a different dimension value (in our case customerIds). For a final touch of user friendliness, put {{VARIABLE_NAME}} in the Alias field so that the values show up in the key of the graph.
And there you have it: a simple but useful Grafana graph for tracking customer behavior.

Next Steps
There is obviously a ton more stuff that Grafana is capable of including alerts and other panel types. My main recommendation for a followup is to check out the other tabs in the edit graph UI and play around with the various options. There are also a ton of builtin metrics for other AWS services, like memory use or lambda duration.
Final Thoughts
We know there are strong incentives to be more proactive about metrics tracking and include it earlier in development. As a result, we definitely want to integrate Grafana into more FloQast products. However, one of the biggest challenges for us is knowing what metrics to track. We only started tracking this metric in response to a problem we recently discovered. Ideally, we could know upfront what metrics would be helpful to solve future problems. We can certainly make some educated guesses about what problems will arise (i.e. scaling), but at the end of the day, they are still guesses. Plus customers will always do things you did not expect. It’s probably better to overshoot than undershoot.
As for the added benefits, this one graph about counting sync jobs ended up helping debug other issues we encountered later. When a customer comes to us with a problem, we can check this graph and look for variance against their historical upload pattern. It also ended up being valuable to our customer success team in their conversations with customers about the product and its capabilities. Perhaps most beneficial is that it allows us to make more intelligent data-driven decisions that lead to a better product, which is, of course, what this is all about.
Back to Blog
